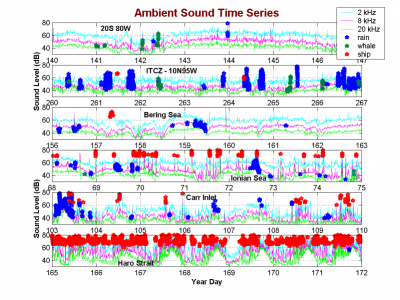
Below is a plot showing one week of data collected at various locations. Each plot contains the location of the recorded data, such as the Bering Sea (in plot 3) and Carr Inlet (in plot 5). Sound sources in each location have been identified and are shown in the plot. Data has been provided by J. Nystuen.
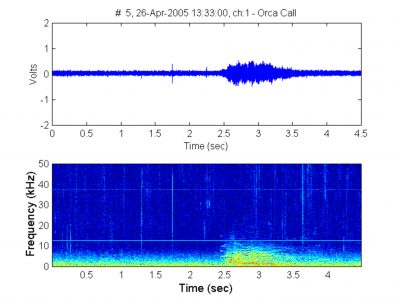
Below is a portion of data that was recorded and classified as an Orca call. Data provided by J. Nystuen.
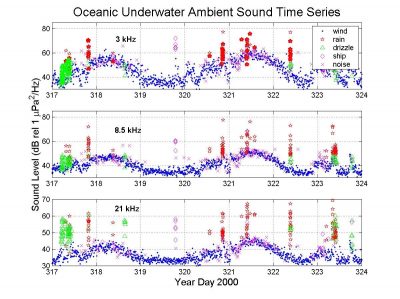
Here is another example of a week-long data series recorded by the UPAL system. The slowly varying background is due to wind. Events from rain, drizzle, ships, biology and other transient sounds are shown. Data provided by J. Nystuen.